Statistics and data analysis can seem daunting to most. Add to that the idea of visualizing the information through graphs, charts and comparison filtering and what you’ve got is a time consuming, almost maddening set of criteria to fulfill. Aggregating information will get the ball rolling, but if you want to truly dissect the data and use the results for refinement or clearer understanding, then you need to use Statwing.
Statwing
Briefly, Statwing takes information on any topic, breaks it down and provides statistical analysis on the data. Think of it as the Excel you wish you had. Where Excel is simplified enough for the most novice of users to input data and track the results, the advanced cross-sheet, formula inclusion, graph creation and chart tracking can be a bit overwhelming for even experienced users.
Statwing automatically reads the data from any spreadsheet (Excel, Google docs, etc.) or .csv file and returns an interface from which users can quickly track, analyze and compare the data.
Intuitive Data Analysis
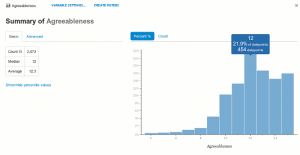
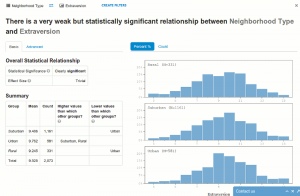
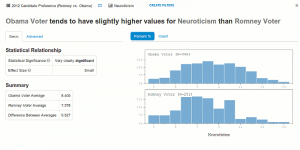
Statwing’s approach is solid. It reads files accurately and in a rather simple form delivers a summary of the data with count, percentage and chart to visualize the data. Along those lines, users can manipulate which data should be excluded with filters (created by the user) as well as change the category assigned to each data segment.
Data handling is done on what’s called a Workspace. Workspaces can be saved and renamed as needed, though saving is best served for those who purchase one of Statwing’s premium packages as they are saved indefinitely. Free account data remains available for 24 hours, a rather short amount of time if you intend to pour over some detailed data.
Real World Testing
Like others, we examined the demo version of Statwing and found that the presentation and potential are outstanding. The possibilities in terms of time savings alone make Statwing a definite tool worthy of making it into any data analyzers toolbox.
We decided to create an account and test Statwing out with our own data and pre-formatted spreadsheet to examine the results in a less controlled way. The results were definitely different than the demo.[blockquote style=”style5″]Disclaimer: I’m especially particular about my spreadsheets and format them heavily for all-on-one-screen aesthetics. I hate to scroll in any direction if I can avoid it, but will always avoid horizontal scrolling.[/blockquote]
The disclaimer is mentioned because that’s likely where things went off the rails. Statwing read the data correctly, even accurately summarized it, but relating the data (comparing it) was less than representative of what the original spreadsheet depicted. Eventually Statwing sorted it out and provided more valuable information as the data related to each other. An adjusted spreadsheet with more generic layout and data was also used. The results were more predictable which indicates formatting may have been an issue in the first attempt.
* For purposes of full disclosure, the spreadsheet in question was that of a fuel expenditure with varying amounts, dates of purchase, totals and separation by month and day.
Overall, the statistical analysis wasn’t able to provide me with the data I was after, though as noted earlier (see disclaimer), the formatting may have been part of the issue.
Interface
If you’re going to stare at numbers and data all day, the presentation better be easy on the eyes or else one migraine later you’ll be wishing you never started. Luckily, Statwing’s interface is aesthetically pleasing. Mostly white with subtle shades of blue for functionality.
Navigation is clearly visible and uncomplicated with most essentials located in the same general area of the screen.
Statwing Workspaces can be shared via direct link sharing and recipients are not required to have a Statwing account to view shared Workspaces.
We’d like to see a built-in print function available to quick print charts and statistics. Standard printing through the browser was troublesome at best and unusable at worst. Saving is awesome and while we applaud the idea of 100% cloud functionality, users can often benefit from having a printout of things likes charts where they can highlight, circle and scratch notes on.
Plans & Pricing
There are three pricing plans available. The free account will grant you access to a saved file for 24 hours with a maximum file size of 1mb. Statwing’s premium packages offer higher size limits and unlimited life span on files.
Statwing Future
We aren’t sure where Statwing is heading, but with some small tweaks to the interface and more advanced graphing of data coupled with the existing, basic inner guts, they have the potential to become a standout resource.
Something worth considering moving forward would be a demonstration of how Statwing reads the data for a layman. The goal being to better describe to users how Statwing interprets formatting and where it expects data to be in relation to how it delivers results.
Final Thoughts
Having seen what Statwing is capable of in the demos, it’s hard not to question whether formating spreadsheets differently in the future should be considered in order to take advantage of this outstanding free service. While the statistics retrieved didn’t fully reach expectations, Statwing did demonstrate how intricately it reads files and interprets the data. We expect further enhancements which will expand on results output and broaden the analysis.
Statwing should be in your resource kit if data analysis is important and must be in your kit if it’s part of your livelihood.
Our advice is to create a free account with Statwing and see just how accurate the results are from your own spreadsheets and .csv files. Share your thoughts here to give others another point of view.
Visit Statwing
If you enjoyed or found this article useful, please show us some support by liking us on Facebook or by sharing us on your favorite social website. Thanks!
Be sure to subscribe to our Newsletter for updates and contest information.


